Is this site down or just me? How to tell in 2 minutes
Is the site down for everyone or just you? A 4-step test, what DNS, timeout, certificate, 502, 503 and 522 errors mean, and who has to fix them.
Is this site down, or is it just you? Before you restart the router, settle that one question. It takes two minutes, and the answer decides everything you do next. If the site itself is down, all you can do is wait or tell the owner. If the problem is on your side, you can usually fix it yourself in a few minutes. The symptom helps: a missing domain, no answer, a certificate error and a 503 look different in the browser and have different culprits. We measured each of them on 21 October 2026 — with curl, in the Chromium browser and with the function our link monitoring uses to check destinations. At the end we cover what to do when the site that is down is your own, or when a printed link or QR code leads to it.
Is this site down for everyone or just me? A 4-step test
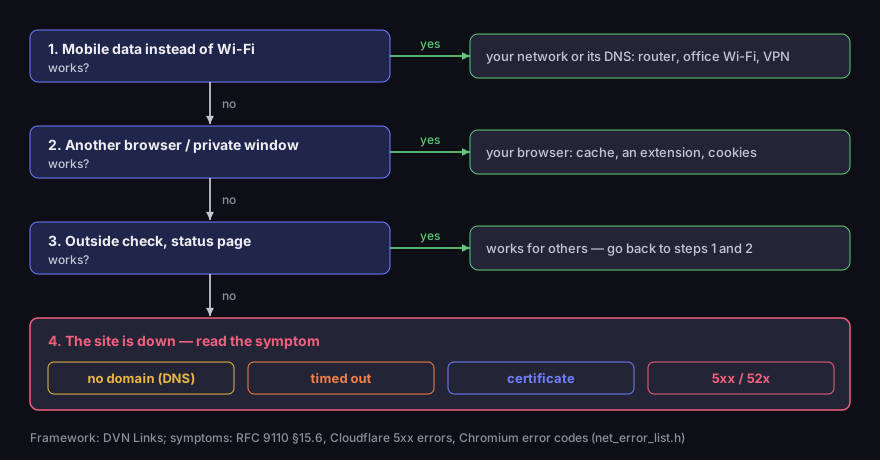
The test has four steps, from the cheapest to the most detailed. Each one rules out a group of causes.
1. Open the site on mobile data instead of Wi-Fi. Turn Wi-Fi off on your phone and type the address again. If the site works, the problem is in your network: the router, office Wi-Fi that blocks something, a VPN, or the DNS server your network uses. The site is healthy — the road to it is not.
2. Open it in another browser or a private window. A private window starts without your saved cookies and usually without extensions. If the site works there, your browser is to blame: an old copy in the cache, an extension blocking scripts, a broken login cookie. Clear the data for that one site or turn extensions off one by one.
3. Check from outside. "Is it down" tools open the address from their own server and tell you what they got. Large companies — banks, airlines, telecoms — also run status pages and social media accounts where they announce outages. If the site fails from outside too, the site is down, not you.
4. Read the symptom. The browser's message tells you at which stage the request stopped. That decides who has to fix it — more on this in the next section.
Is this site down for everyone or just you?
a four-step test; each step rules out one group of causes
Source: DVN Links framework; symptoms: RFC 9110 §15.6, Cloudflare, Chromium error codes
Figure description
Decision tree. Step 1: mobile data instead of Wi-Fi — if the site works, your network or its DNS is to blame: router, office Wi-Fi, VPN. Step 2: another browser or a private window — if it works, the browser is to blame: cache, an extension, cookies. Step 3: an outside check and the status page — if it works for others, go back to steps 1 and 2. If it fails everywhere, step 4: the site is down, read the symptom — no domain (DNS), timed out, certificate, or a 5xx or 52x code.
Two situations look like an outage but are not. A browser warning about a dangerous site (a red screen before the page) is a security verdict, not an outage — how to read it is covered in our guide is this link safe?. And a 404 means the server works, there is just no page at that address — that is the subject of our article on 404 Not Found.
What the error means: DNS, timeout, certificate, 5xx
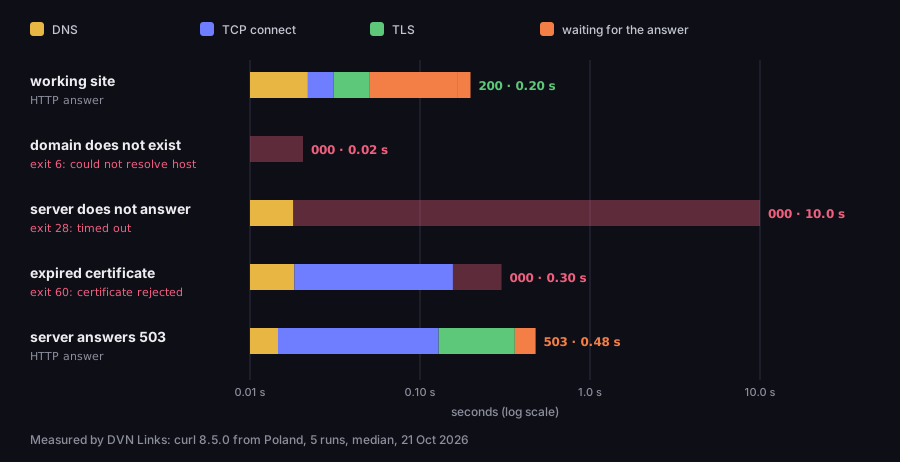
Every failure stops the request at a different point. The browser first asks DNS which IP address the server has, then connects to it, then negotiates encryption (TLS), and only then asks for the page. We measured five situations with curl — five runs each, with a 10-second limit — and each looks different.
Five failures, five different symptoms
curl, median of 5 runs, 10 s limit; log scale
Source: DVN Links measurement, curl 8.5 from Poland, 21 Oct 2026
Figure description
Bar chart of request phases. Working site: DNS, connect, TLS and answer, status 200 after 0.20 s. Domain does not exist: stops at DNS after 0.02 s, status 000, curl exit 6. Server does not answer: DNS fine, then waiting until the limit, status 000 after 10.0 s, exit 28. Expired certificate: DNS and connect fine, rejected at TLS, status 000 after 0.30 s, exit 60. Server answers 503: all phases pass, status 503 after 0.48 s.
The domain does not exist, or DNS does not answer. Chromium shows ERR_NAME_NOT_RESOLVED — described in the browser's code as „The host name could not be resolved” (Chromium, net_error_list.h). In our measurement this is the fastest failure: 0.02 seconds, because there is nobody to connect to. The cause may be a typo in the address, an expired domain, a mistake in the owner's DNS settings, or a failing DNS server on your network. You will spot the last one in step 1: on mobile data, with different DNS, the site works.
The server does not answer. ERR_CONNECTION_TIMED_OUT — „A connection attempt timed out” (same source). The browser waits until the limit runs out and only then gives up; curl with a 10-second limit waited to the end on every run. This symptom comes from a server that is off, an overloaded server, a firewall that drops traffic without answering, or a network failure on the way. Note that an overloaded server does not have to answer with a 503. The HTTP specification says so plainly: „The existence of the 503 status code does not imply that a server has to use it when becoming overloaded. Some servers might simply refuse the connection” (RFC 9110, §15.6.4). No error message does not mean the problem is yours.
Your connection is not private. With an expired certificate Chromium reports ERR_CERT_DATE_INVALID. The comment in the browser's code lists three possible causes: an attacker with an old certificate, a misconfigured server and — easy to miss — „Our clock is wrong”, a wrong clock on your device (same source). If you see the same error on many sites at once, check the date and time on your phone or computer. If only on one, the certificate expired on the owner's side. In our measurement curl rejected the connection after 0.30 seconds, during the encryption handshake.
5xx codes. Here the server did answer — and admitted that it failed. The specification defines the common ones like this:
- 500 — the server „encountered an unexpected condition that prevented it from fulfilling the request”: an application error (RFC 9110, §15.6.1);
- 502 — an intermediary server (a proxy or gateway) received an invalid response from the server it passed the request to;
- 503 — „temporary overload or scheduled maintenance” (RFC 9110, §15.6.4);
- 504 — an intermediary server did not get a timely answer from the server behind it.
With each of them the server should explain whether the problem is temporary or permanent (RFC 9110, §15.6). With a 5xx neither another network nor another browser helps — you wait or contact the site's owner. Programs that talk to a server through an API get the same classes of codes — how to read them is explained in our guide to REST APIs. "Too many redirects" (ERR_TOO_MANY_REDIRECTS) is a different story again: a redirect loop on the server, covered in our article on HTTP 302 vs 301.
If you have a terminal to hand, one command shows the same breakdown — this is how we measured the chart above:
1curl -s -o /dev/null -m 10 -w "status %{http_code}, time %{time_total} s\n" https://example.com/2echo "exit $?"A status of 200 or 3xx means the server works. A 5xx means it answered but failed. 000 means there was no HTTP answer at all, and curl's exit code gives the reason: in our measurement 6 for a missing domain, 28 for a timeout and 60 for a rejected certificate. Run on your machine, the command shows what your network sees; run from a server or by a friend on another network, what others see.
Symptom of a failure: what the browser sees and what monitoring sees
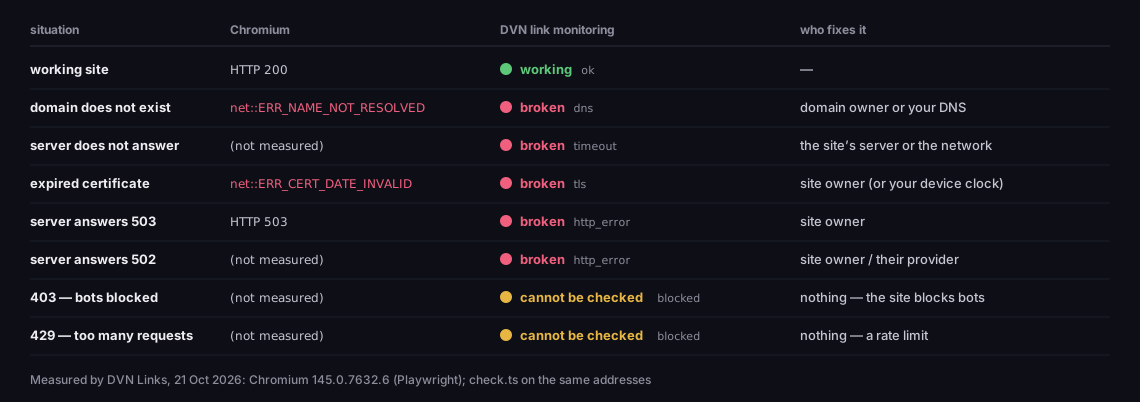
Chromium 145 and the DVN Links monitoring check on the same addresses
Source: DVN Links measurement, Chromium 145 (Playwright) and check.ts, 21 Oct 2026
Figure description
Table from our measurement. Working site: Chromium HTTP 200, monitoring working. Domain does not exist: Chromium net::ERR_NAME_NOT_RESOLVED, monitoring broken (dns), fixed by the domain owner or your DNS. Server does not answer: monitoring broken (timeout), fixed by the site's server or the network. Expired certificate: Chromium net::ERR_CERT_DATE_INVALID, monitoring broken (tls), fixed by the site owner or your device clock. 503 and 502: monitoring broken (http_error), fixed by the site owner. 403 and 429: monitoring cannot be checked (blocked) — the site blocks bots or rate-limits.
Errors 520–526 — a site behind Cloudflare is down
A code from 520 to 526 on a page with the Cloudflare logo means Cloudflare is working but cannot get through to the site owner's server. Cloudflare sits in front of many sites as an intermediary: it takes your request and passes it on to the so-called origin server. Its 52x codes say what went wrong on that second leg — and that leg never depends on your phone.
- 520 — the origin server returned an unknown error (Cloudflare, 5xx errors).
- 521 — „the origin web server refuses connections from Cloudflare” (Cloudflare, error 521).
- 522 — Cloudflare could not connect: it got no reply to its connection attempt „within 19 seconds after sending a SYN” (Cloudflare, error 522).
- 523 — the origin is unreachable.
- 524 — there was a connection, but the server did not answer „before the default 125 seconds Proxy Read Timeout” (Cloudflare, error 524) — the server accepted the request but takes too long to answer.
- 525 and 526 — an encryption problem between Cloudflare and the server: a failed TLS handshake or an invalid origin certificate.
The thresholds in the documentation help with diagnosis: a 522 after roughly 19 seconds means the server is not accepting connections at all; a 524 after two minutes means it accepts them but takes too long. As a visitor you cannot fix anything here. As the owner, look for the cause on your own server, not at Cloudflare — unless Cloudflare's status page says otherwise.
Provider outages: when "the whole internet is down"
Sometimes it is not one site that is down but hundreds at once — because they all rely on the same provider. Then the first place to look is the provider's status page, not the site owner's, who is waiting too.
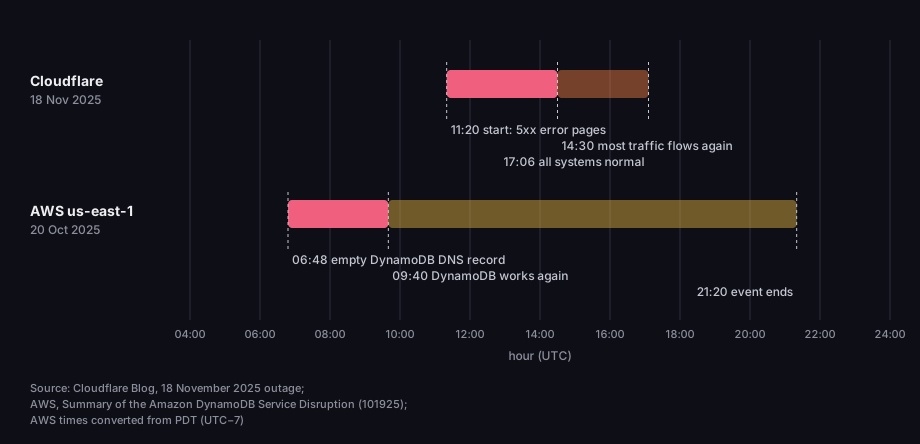
On 18 November 2025 at 11:20 UTC Cloudflare's network began, in the company's words, „experiencing significant failures to deliver core network traffic”. Visitors to sites using Cloudflare saw error pages with 5xx codes. Core traffic was largely flowing as normal by 14:30, and by 17:06 all systems were working normally. Cloudflare states the cause was a change to the permissions of one of its database systems, not a cyber attack (Cloudflare Blog, 18 Nov 2025).
A month earlier, on 19–20 October 2025, Amazon Web Services had an outage in its us-east-1 region. The event ran from 11:48 PM on 19 October to 2:20 PM on 20 October Pacific time (PDT). It started with DNS: a fault in the system that manages DynamoDB's DNS records left „an incorrect empty DNS record for the service's regional endpoint”. Between 11:48 PM and 2:40 AM PDT customers and other AWS services that depend on DynamoDB could not open new connections to it (AWS, event summary). To visitors of sites built on that infrastructure, it could look as if each of them had failed separately.
When "the whole internet is down": two provider outages
UTC; AWS converted from Pacific time (PDT, UTC−7)
Source: Cloudflare Blog (18 Nov 2025), AWS (event 101925); time zone conversion by DVN Links
Figure description
Timeline. Cloudflare, 18 Nov 2025: from 11:20 UTC 5xx error pages, by 14:30 most traffic flows again, from 17:06 all systems normal. AWS us-east-1, 20 Oct 2025: from 6:48 UTC an empty DynamoDB DNS record, by 9:40 UTC DynamoDB works again, the whole event ends at 21:20 UTC.
The practical lesson: when sites of different companies fail at the same time, check the status pages of the big providers — cloud, CDN, payments. If it is your site, the same source will answer your customers' question faster than your team.
User reports or active checks — how anyone knows a site is down
You learn about an outage in one of two ways, and both lag. The first is user reports: services where people report problems with popular sites, and social media. That only works for a service many people use at once — nobody will post there about a small shop being down. The second is active checking: a program queries the site regularly and raises an alarm when it stops answering. It needs no crowd, but it sees the world only from where it asks, and only as often as it asks.
Both can be wrong in the same way: they see the world from somewhere other than you. A tool that checks an address from a server in another country may get an answer you do not get — or the opposite, if the site blocks traffic from abroad or from bots. So "it works" from outside while it fails for you does not close the case; it sends you back to steps 1 and 2. For the same reason, when our robot gets a 403 or 429 it does not declare an outage: the site may have refused only the robot.
Uptime monitoring tools ask every few minutes or more often. One example from a pricing page: UptimeRobot lists a „5 min. monitoring interval” on its free plan, and 60, 30 and 15 seconds on paid ones (UptimeRobot, pricing). A tool like that tells you about your own site going down within minutes.
Google has a view on outages too, and it is worth knowing, because the market exaggerates. According to its documentation, 5xx and 429 codes make Google's crawlers „temporarily slow down with crawling”, and already indexed URLs „are preserved in the index, but eventually dropped” — only if the error persists (Google, HTTP status codes). Google treats timeouts, connection resets and DNS errors „similarly to 5xx server errors”, and with network errors „crawling immediately starts slowing down” (Google, DNS and network errors). An hour-long outage will not knock you out of the results; one that goes on and on will.
When it is your website that is down
If it is your own site that is down, first establish the symptom with the same test a visitor would use, then act on it.
DNS error. Google says plainly that DNS errors „are most commonly caused by misconfiguration” (Google, DNS and network errors). Check that the domain is paid for and review recent record changes — especially after moving hosting or changing your intermediary.
Certificate. An expired certificate is an outage you can predict to the day. If it renews automatically, check that the automation still runs; if manually, put the date in a calendar with a margin.
Maintenance. When you take the site down on purpose, answer with a 503, not a "down for maintenance" page with status 200. The specification describes 503 as exactly „temporary overload or scheduled maintenance”, and the server can say when to come back in a Retry-After header (RFC 9110, §15.6.4). For Google that signals a temporary failure; a maintenance page served with 200 looks like ordinary content.
500, 502 and 504. A 500 is an error in the application itself — look for the cause in its logs. A 502 or 504 comes from an intermediary server when the application behind it answers wrongly or too slowly (RFC 9110, §15.6). The web server itself is fine; what needs fixing stands behind it: the application process, the database, a queue.
Find out first. The worst way to learn about an outage is an email from a customer. Set up uptime monitoring that checks your site from outside every few minutes, and check where its alerts go — an inbox nobody reads at the weekend is no monitoring at all. Separately, keep an eye on the dates you know in advance: domain and certificate expiry.
Communication. A status page or a social media post saves you customers' questions. Anyone who has run our four-step test will look there in step 3.
Printed links and QR codes: when the destination stops working
A printed QR code leads where it led on the day it was printed — even if the site behind it no longer works. A flyer will not tell anyone that the shop changed the address of its offer or that the server went down. A customer scans the code, sees an error and decides the code is broken. If the code does not scan at all, that is a different problem, covered in our guide on minimum QR code size.
This is what link monitoring in DVN Links is for, available from the Pro plan. Once a day it checks whether the destination of a short link answers. If it does not, it checks again after an hour, and if the failure repeats a second time in a row, it sends an email alert. When the site comes back, a second email arrives: "works again". Every link's status shows in the dashboard as a coloured dot with the reason and the time of the last check. Plans from Business add a weekly report. Compare plans on the pricing page.
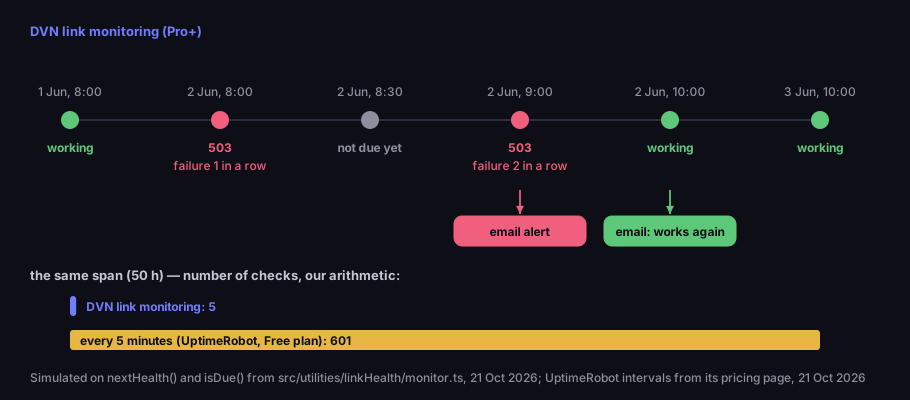
The rhythm of link monitoring: once a day, not every few minutes
simulated on the real monitoring logic; compared with a 5-minute interval
Source: simulated on nextHealth() and isDue() from the DVN Links code, 21 Oct 2026; UptimeRobot interval from its pricing page
Figure description
Timeline. 1 June at 8:00 the destination works. 2 June at 8:00 it returns 503 — failure 1 in a row, no alert. At 8:30 not due yet. At 9:00 503 — failure 2 in a row, email alert. At 10:00 working — email: works again. 3 June at 10:00 working. Below: over the same 50 hours link monitoring checked the destination 5 times; a tool checking every 5 minutes would have done so 601 times.
Why an alert only after the second failure? Because one bad minute of a server is not news — if we wrote after every stumble, nobody would read the emails. Why once a day? Because this is not uptime monitoring of your website. Link monitoring makes sure a link on a flyer, poster or package does not lead into the void for weeks until someone happens to notice. If you need to know about your own site going down within minutes, use an uptime monitoring tool; our monitoring does not replace it.
The robot classifies symptoms as in the table above: a missing domain, an expired certificate, no answer and 5xx codes all count as "broken". A server that stays silent is recorded as a timeout (timeout, shown in the dashboard as "the page does not respond"), and one that refuses the connection outright as a connection error (connection). For the alert it makes no difference: both reasons mean "broken". It treats 401, 403 and 429 as "cannot be checked" and sends no alert — many sites answer bots this way and show the page to people normally. Monitoring checks the link's destination address; it does not check the destinations of smart link rules, A/B test variants or files uploaded to DVN Links. How the robot asks a site is described in detail in our article on 404 Not Found.
The most common scenario is not dramatic. An offer ends, someone deletes its page or moves the shop to a new platform, and flyers with the code are still lying at the till. The server works; there is just a 404 at the old address. Monitoring treats a 404 the same as a server failure: the link leads nowhere, so you get an alert. If the shop redirects old addresses to its home page instead, the robot sees a working page and there is no alert — monitoring will not catch that case.
When an alert arrives, you do not need to reprint the flyers. Change the short link's destination in the dashboard — the link and the printed QR code stay the same, and monitoring checks the new address on its next run, without waiting a day. All link features are on the features page.
Frequently asked questions
Open it on mobile data and in a tool that checks the address from outside. If it fails in both, the site is down, not your connection.
Try another browser or a private window, turn off your VPN and blocking extensions, restart the router. If the site works on mobile data but not on your home Wi-Fi, the culprit is usually your network's DNS or router.
Most often because the phone is on mobile data and the computer is on another network — with different DNS, a firewall or a VPN. If both devices are on the same Wi-Fi, the computer's browser is the more likely culprit: the cache, an extension, or a wrong system clock if you see a certificate error.
It helps when the problem is in your network — the site works on mobile data but not on Wi-Fi. With a 5xx code, a 52x error or an outage visible from outside, a restart changes nothing, because the problem is on the server's side.
The server is temporarily not accepting requests — because of overload or planned maintenance. Try again in a few minutes; sometimes the server says when to come back in a Retry-After header.
The site uses Cloudflare, and Cloudflare could not connect to its server — it got no reply within 19 seconds. The fault is on the site owner's side, not yours.
A short one does not: Google slows its crawling and keeps the URLs in its index. URLs that keep returning a server error for a long time drop out of the index.
Printing a link or a QR code? Link monitoring checks every day that the destination works and tells you before a customer does — from the Pro plan, details on the pricing page. Create an account to start.